I have been racing cyclocross just over 10 years. My first races were in 2014. I find the mix of 100% exertion, bike handling skills and grit to be very addictive. And since I started racing have tried to get more insight to what is happening during a race. The static statistics and charts provide by Strava or Training Peaks give a high level overview, but do not allow you to easily dig into the all important start, individual laps, shorter power sections, or individual corners.

I did a couple attempts with various UI various (including JET, Oracle's UI framework) and after of course with my own framework Reken. One of the issues I ran into was getting access to an easy to use mapping javascript library. Then I came across on https://openmaptiles.org. It provides free map tile hosting. With the opensource javascript map library https://maplibre.org/maplibre-gl-js you can control the display of the map in your application. This is al opensource, free and available for commercial use.
With mapping now solved, I developed my official cyclocross race analysis tool called Lap Track Racing. It can be found at the following address: https://laptrack.racing.

The application is written with the Reken framework, which made it easy to wire up all the dynamic data structures to the UI. In Reken I created a number of components to support the UI, there are a tooltip, map, rangeslider and table components.
With the application you open a race data file, three different data formats are supported: fit, tcx and gpx. After the file is loaded, Lap Track automatically determines the race section, the start, finish and laps in the file. If for some reason it is not correct, it can be adjusted.

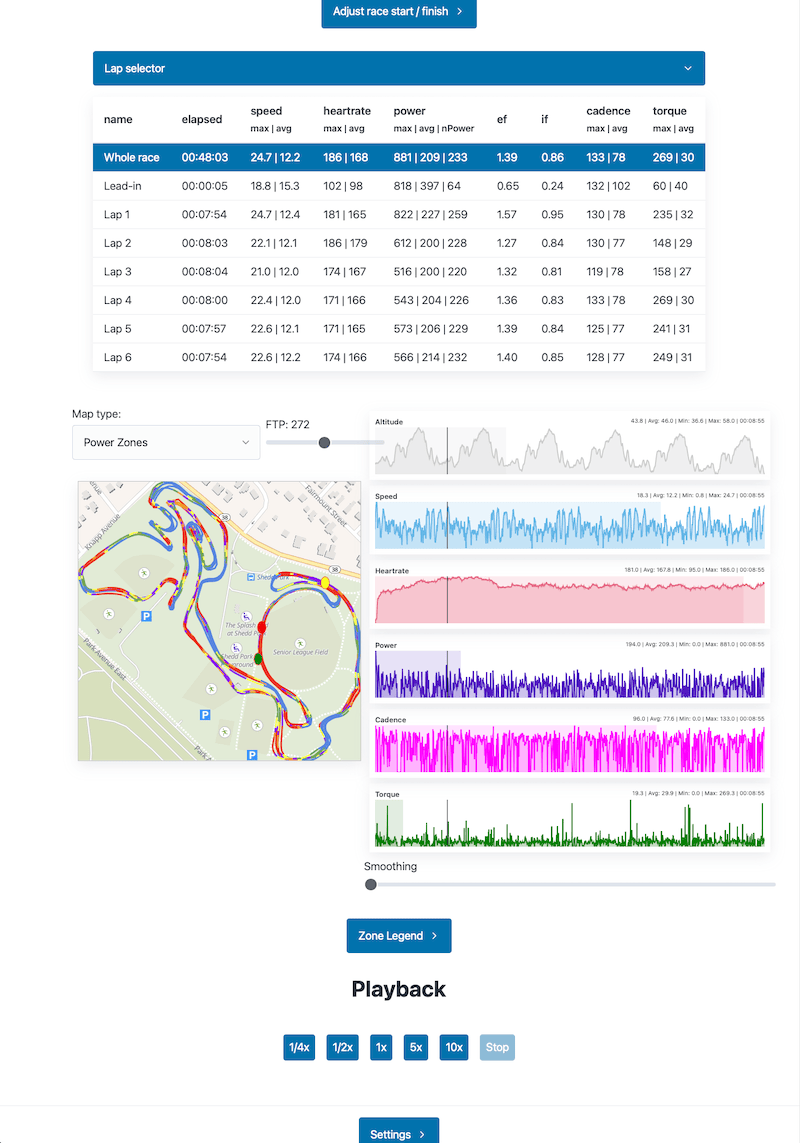
The application then displays a table with the laps, a map with the color coded racetracks, and various charts with metrics such as speed, watts and heartrate.
With the lap table you can select individual laps, the map supports 8 different map types: for example powerzones, heartrate changes, and corner statistics. The charts show trend, actual value, min and max. All the can be interacted with by hovering over datatips to provide more detail.
At the moment the application is in closed beta, to enter the beta you need to fill out a quick survey, after which you get access information.
Interested in trying Lap Track out? Fill out the onboarding survey and I'll send you the activation code.
To learn more about Lap Tracks functionality check out the Lap Track Tutorial what walks you through all the functonality.

In the future I plan to provide a free version and a paid version with all the functionality available.


