After having reviewed the Update and Summary pages in part I and the Activities page in part II, today we will have a look at the Segments page.
On the segment page you get an overview of your Strava segments. It defaults to sorting by your segment rankings. If you have any KOM's they will show first, then your 2nd and 3rd places etc. I don't have many KOM, but there are a few. Mostly in remote places.

You can also sort by the other columns. A fun one is for example to order by the amount of "tries" of a segment. In my case the segment "Pondside sprint" in Lexington at rode the most; 251 times.
Another interesting column is the "Time behind leader". The biggest gap I had was on a D2R2 ride where I came in 3hrs and 16 mins after the leader.
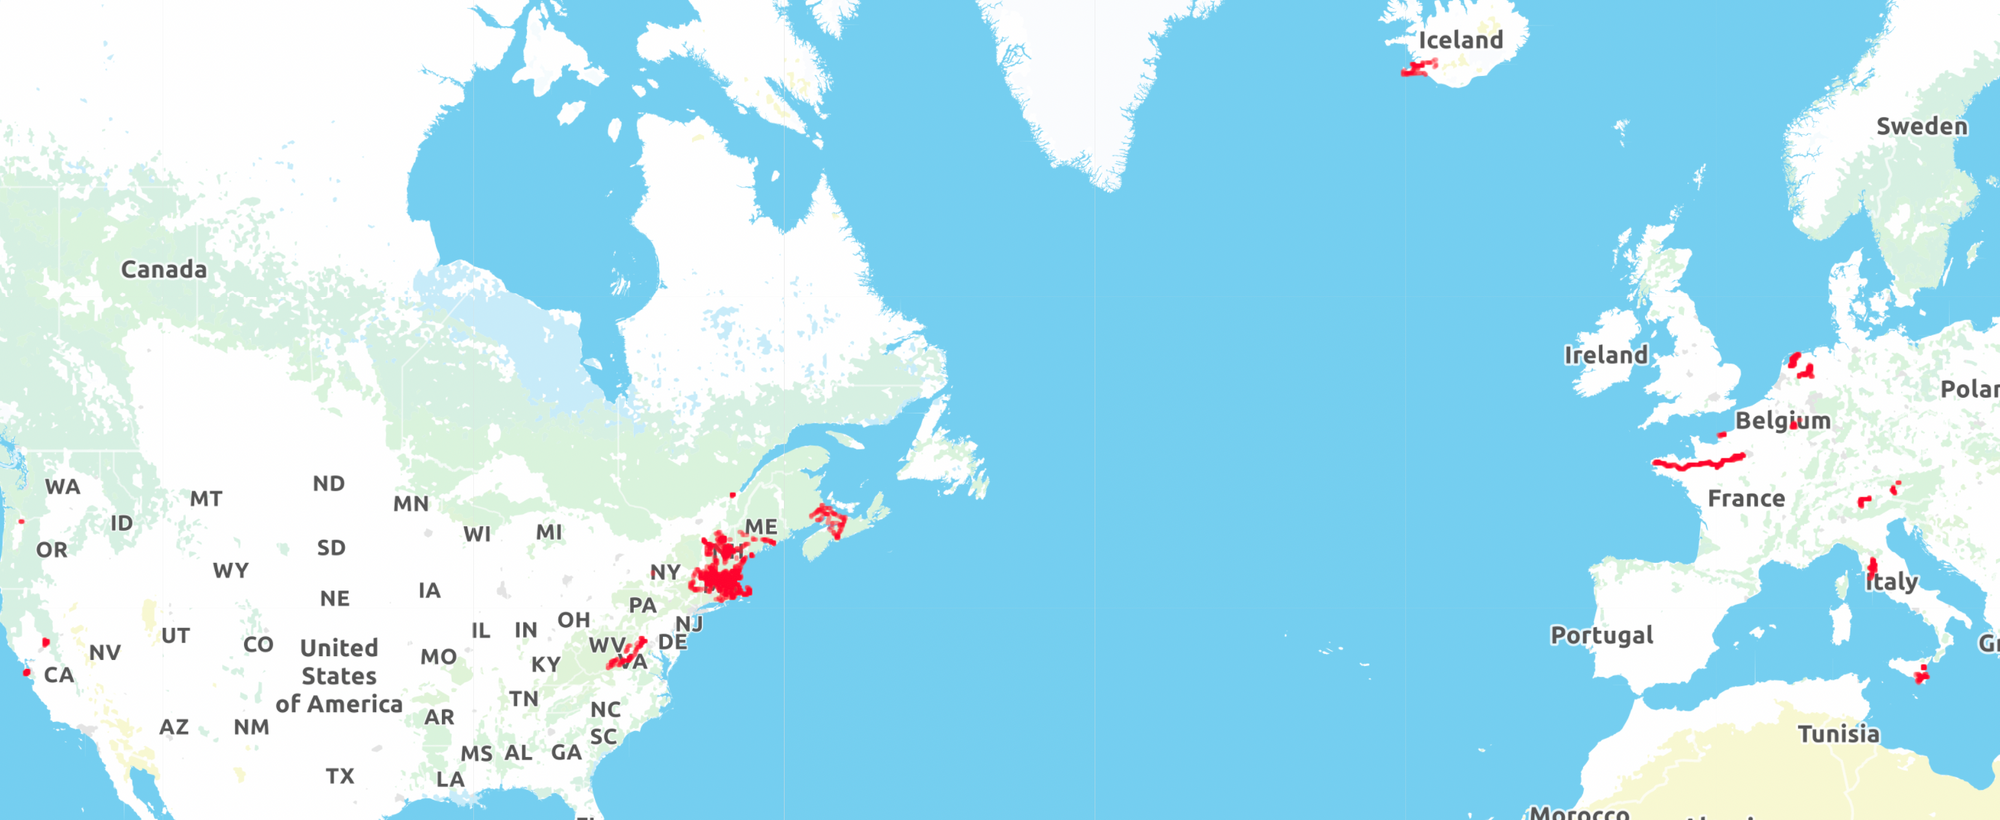
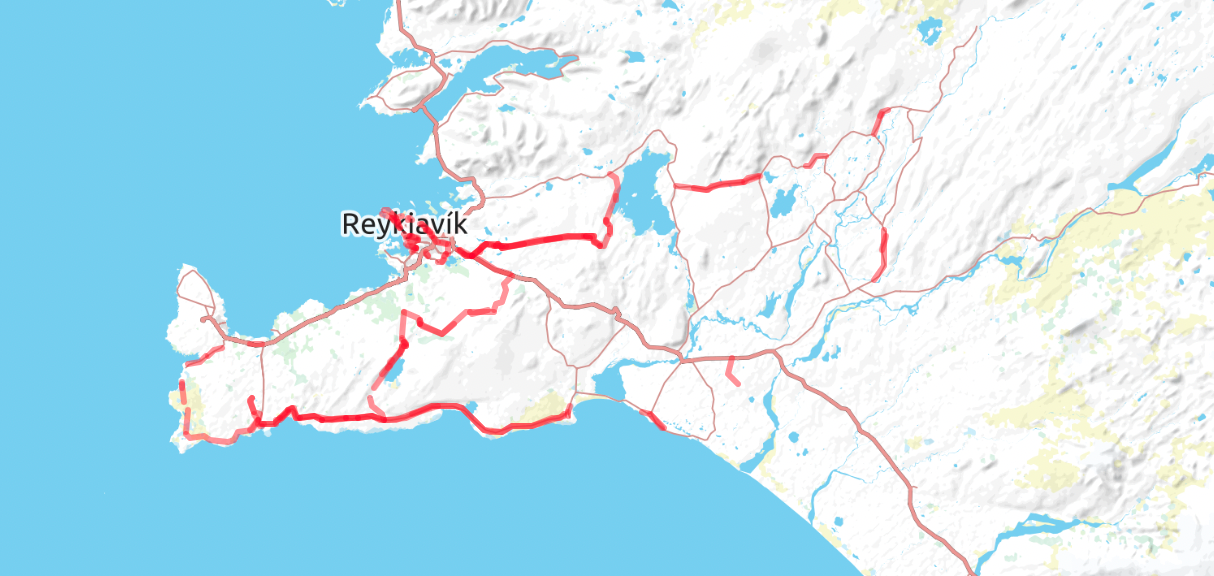
You can also show all your segments in a map. It starts with a world view and see you segments as hotspots, but when you zoom in, you can see the individual segments. Today I was talking to Jonathan on a ride and he mentioned he had seen my name on segments in Iceland. A couple years back I did a 4 day solo touring trip in Iceland. So here it is the segments I did in Iceland.
You can also show your segments on a chart and set segment attributes on the x- and y-axis, control the size and color of the bubbles. Below I show on the x-axis time and on the y-axis the segment position. This charts gives an nice indication of popular segments, as they literally bubble up. You can then hover over the bubble to see the segment details.

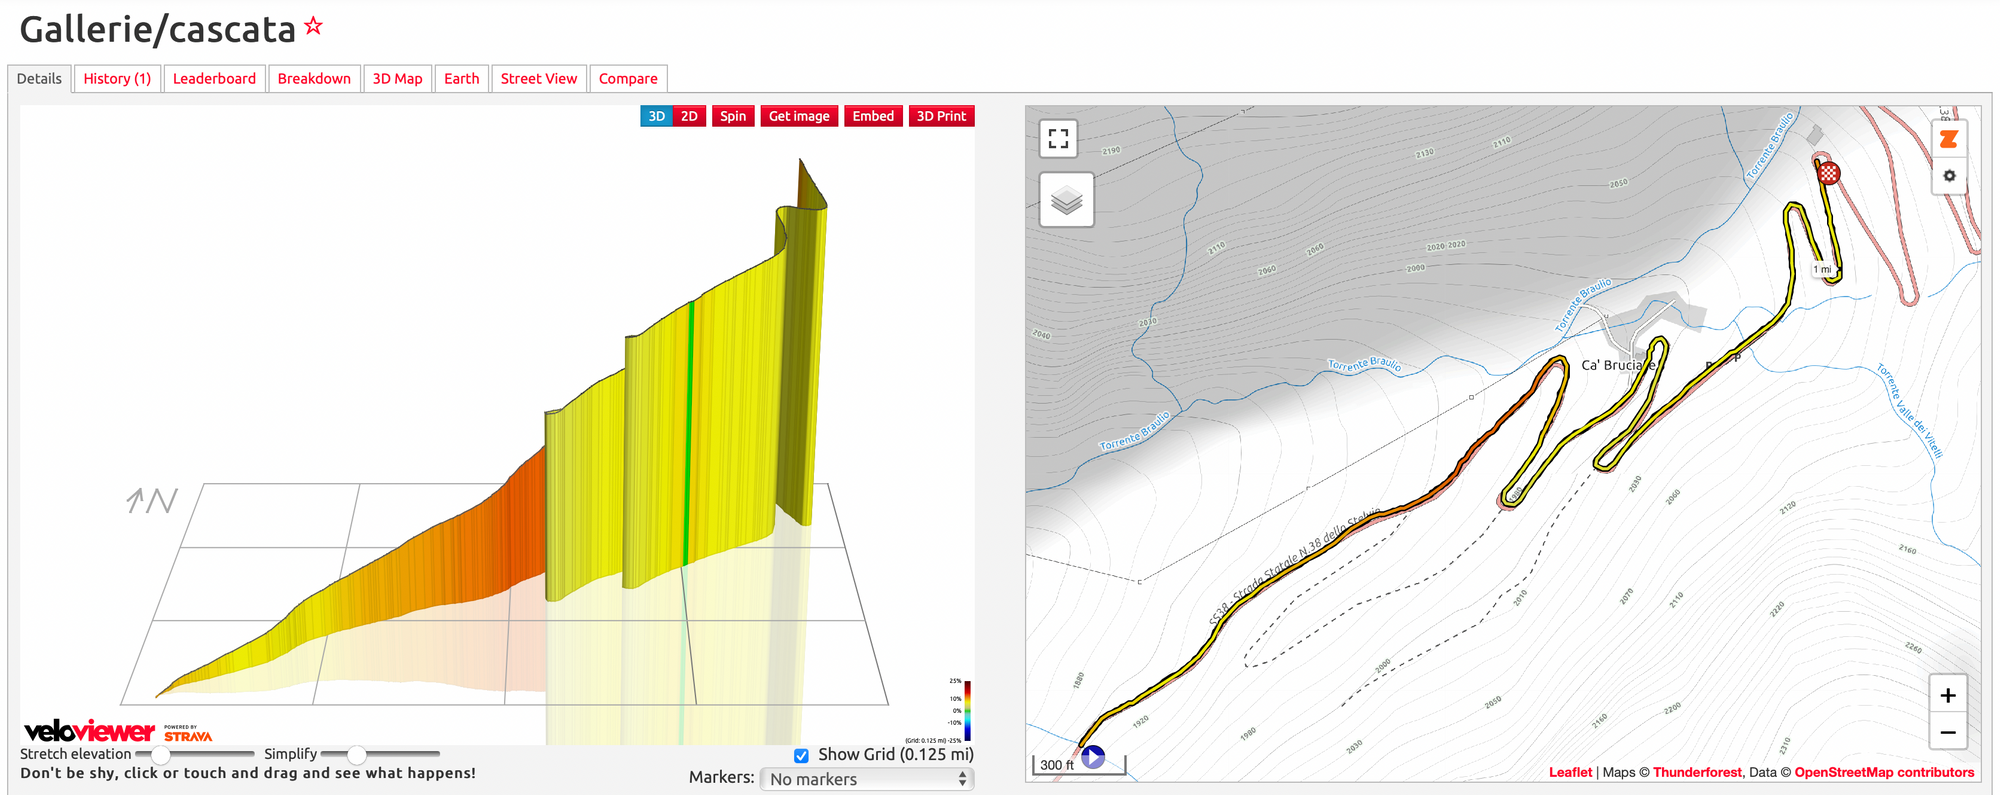
When you click on a segment you get all the segment details on a seperate page. First it shows the elevation and segment route.
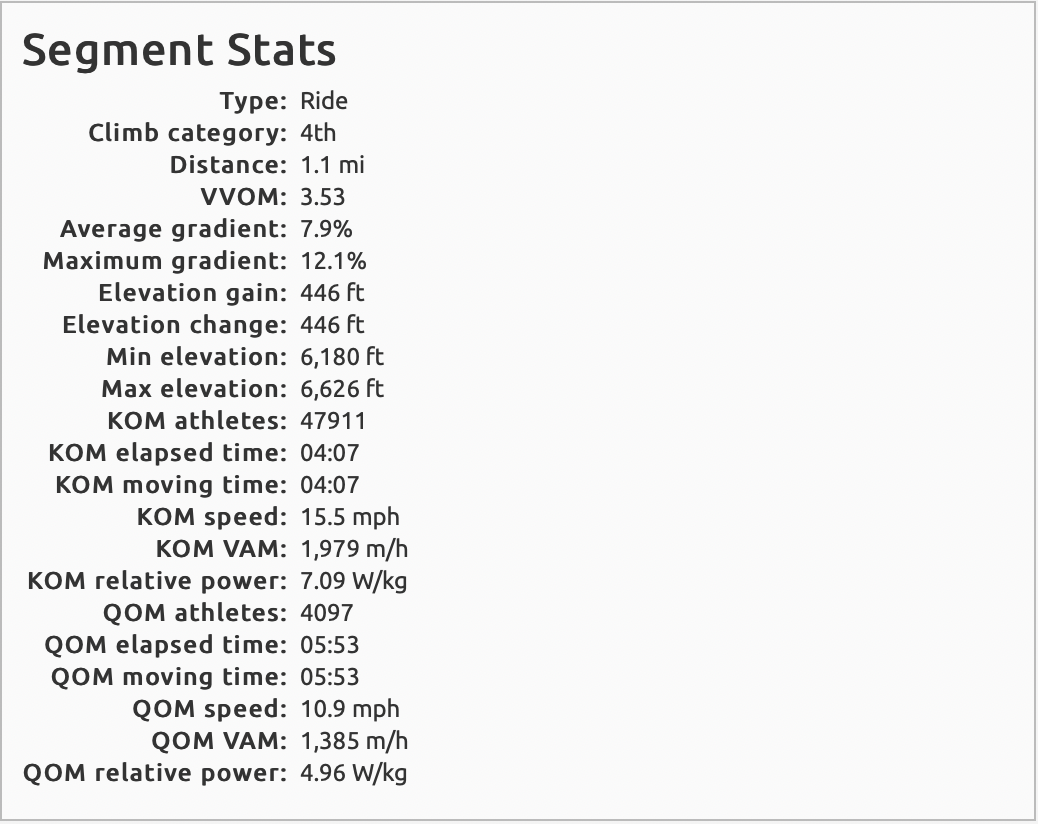
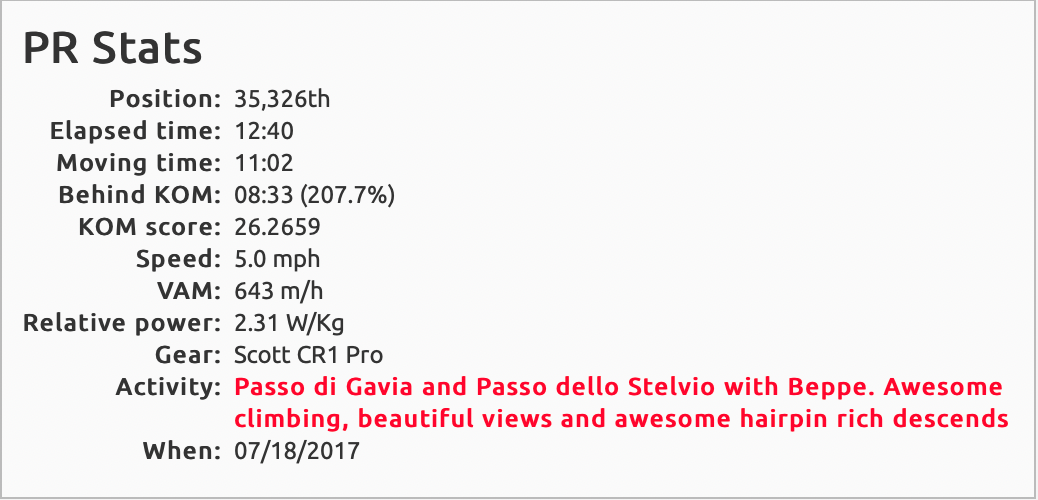
Below it you see the general segments stats, and next to it your personal segments statistics.
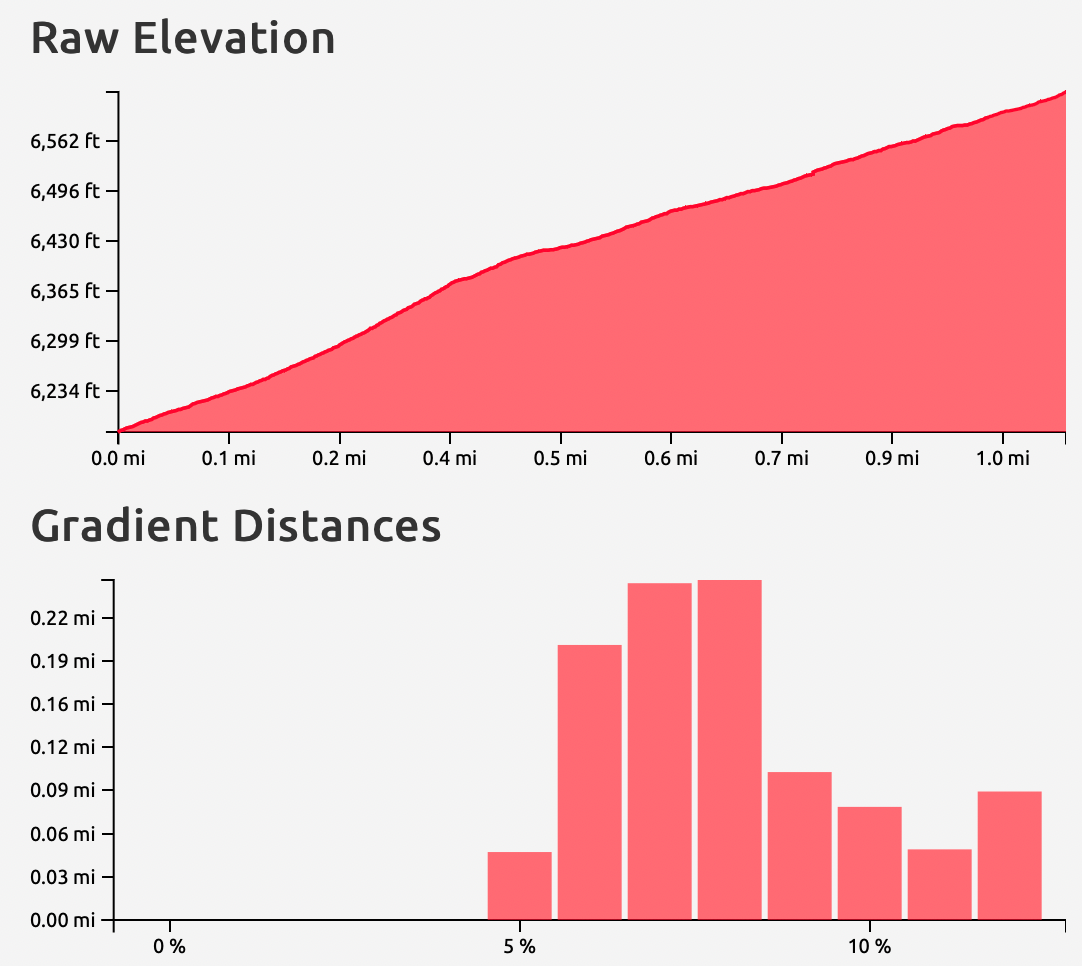
Then it shows elevation details, again a elevation profile now in 2d and a breakdown of the grades in miles. The grade varied between 5% and 12%.
Next time we will have a closer look at the Efforts page.

